
بيع ساخن


التطبيق


Phone:+86-15215969856 E-Mail: 396838165@qq.com
لماذا يبقى الناتج الأحمر المتغير الأكثر عدم استقرارًا في سير عمل التسامي
في إنتاج التسامي الكبير ، بالكاد يكون الأحمر مجرد لون آخر. إنها القناة الأكثر حساسية في مساحة CMYK بمجرد تفاعل الحرارة والضغط وكيمياء الطلاء وسلوك النسيج مع بعضها البعض. غالبا ما تؤدي الانحرافات الطفيفة في ظروف النقل إلى تحولات برتقالية ، أو أحمر داكن طيني ، أو فقدان التشبع ، أو تدرجات غير متساوية ، حتى عندما تبدو الألوان الأخرى مستقرة.
على عكس الألوان السيانية والأسود، يعتمد الأحمر على توازن دقيق بين كثافة اللون الماجنتا والانتشار الأصفر. يتعطل هذا التوازن بسهولة بسبب الرطوبة في الورق، ومعدل امتصاص الطلاء، وتقلبات درجة الحرارة، أو التغييرات الدقيقة في لزوجة الحبر. توفر المعاينة البرمجية ومعايرة المراقبة مرجعًا نظريًا ، لكنها لا تعكس السلوك الكيميائي الذي يحدث أثناء نقل التسامي.
هذا هو السبب في أن مخطط الألوان التسامية لا يزال الأداة الفيزيائية الأكثر موثوقية للسيطرة على الإنتاج الأحمر لأنه يلتقط التفاعلات الحقيقية بين الحبر والورق والحرارة والنسيج. عند استخدامها بشكل صحيح ، يمكن أن تصبح أداة تشخيصية بدلا من ورقة عينة بصرية.
ما الذي يمثله مخطط الألوان التسامية حقا في الطباعة الصناعية؟
توازن CMYK بعد النقل
مخطط الألوان المناسب ليس صفحة اختبار الطابعة ، ولكن خريطة مادية لسلوك الألوان بعد النقل. تعكس كل تصحيح كيفية تصرف نسبة CMYK محددة بعد هجرة صبغة مدفوعة بالحرارة إلى ألياف البوليستر.
تفترض الملفات الرقمية التحويل المثالي، ولكن الرسم البياني الألوان يظهر الواقع. مع النغمات الحمراء ، غالباً ما يكون هذا الفرق كبيراً. ستلاحظ أن بعض الأحمر قد يصبح بنيًا ، والبعض الآخر يتحول نحو البرتقالي ، والبعض يفقد العمق على الرغم من ظهوره الصحيح على الشاشة. ويكشف الرسم البياني هذه الانحرافات قبل الإنتاج.
لماذا يتصرف الحبر الأحمر بشكل مختلف عن الألوان الأخرى أثناء النقل؟
حساسية حرارية
تعتمد النغمات الحمراء بشكل كبير على الانتشار الجزيئي أثناء النقل. ارتفاع درجات الحرارة يزيد من حركة الصبغة ، مما يمكن أن يضعف التشبع ، وأوقات الإقامة الطويلة يمكن أن تسوي عمق النغمة. على النقيض من ذلك ، تحافظ درجات الحرارة المنخفضة على الكروم لكنها تسبب نقلًا غير كامل.
هذا يجعل الأحمر أكثر حساسية لعدم اتساق الضغط من السياني أو الأسود. قد يبدو الفرق بين 3 و5 درجات مئوية ضئيلاً على لوحات المعدات ، لكنه يميل إلى أن يكون مرئياً جداً في القناة الحمراء.
كيف يجب اختيار مخطط الألوان الصحيح لتحسين الأحمر؟
المواد المطابقة
يعمل الرسم البياني فقط عندما يتطابق مع ظروف الإنتاج الخاصة بك. يجب إجراء اختبار الرسم البياني في ظل ظروف نفس ورقة GSM ، سلسلة الحبر ، تكوين رأس الطابعة ، درجة حرارة الصحافة ، وقت الإقامة ، ونوع النسيج.
استخدام مخطط عام أثناء تغيير أي من هذه المتغيرات يؤدي إلى استنتاجات كاذبة. بالنسبة للمعايرة الحمراء ، فإن اتساق المواد أكثر أهمية من تعقيد تصميم الرسم البياني.
كيف تقرأ المناطق الحمراء بشكل صحيح على مخطط ألوان التسامي؟
تحديد أنماط الفشل
تكشف المناطق الحمراء عن عدة أنواع من الانحرافات ، بما في ذلك التلوث الأصفر (التحول الأحمر نحو البرتقالي) ، الهيمنة البرتقالية (الأحمر يتحول إلى الأرجواني) ، انهيار التشبع (الأحمر يصبح مملًا أو بنيًا) ، وضغط الظل (الأحمر الداكن يفقد التفاصيل).
أنت لا تختار فقط المربع الأكثر حيوية، ولكن تحليل الاستقرار عبر التدرجات. يحتفظ لون أحمر مفيد باللون عبر النغمات الوسطى والظلال ، وليس فقط عند ذروة التشبع.
كيف يجب تعديل ملفات ICC بعد تقييم الرسم البياني؟
ضبط القناة المستهدفة
يركز التصحيح الفعال على المنحنيات الأزرق والأصفر بدلاً من تطبيق تعديلات التباين العالمية. عادة ما تتطلب المعايرة الحمراء تخفيضا طفيفا من الأصفر في الألوان الوسطى ، ورفع الارجنتي المسيطر عليه في مناطق الظل ، وتجنب التلوث الأسود في المناطق الحمراء العميقة.
يتم تحقيق الاستقرار الأحمر من خلال التكرير المتكرر ، وليس التصحيح لمرة واحدة. يجب أن تتبع كل تعديل طباعة مخطط جديد.
ما هي معايير الإنتاج الأكثر تأثيرا على استقرار الأحمر؟
العوامل البيئية والميكانيكية
الأحمر حساس للغاية لمحتوى رطوبة الورق والرطوبة المحيطة واختلاف ضغط الأسطوانة وانجراف درجة حرارة الصحافة وكثافة بوليمر النسيج. هذا هو السبب في أن بيئات الإنتاج المستقرة تميل إلى تحقيق نتائج أكثر اتساقا من الآلات المتطابقة تقنيا في ظروف غير خاضعة للرقابة. وينبغي طباعة الرسوم البيانية دائما بعد التحولات البيئية، وليس فقط بعد التغييرات المادية.
من هو Changfa Digital, ولماذا يفعل مسألة اتساق المواد لمعايرة الناتج الأحمر؟
تشانغفا الرقمية تعمل كمصنع متكامل عموديا متخصص في إنتاج الورق التسامي ومواد الطباعة الرقمية ، مع أكثر من 15 عاما من وجود الصناعة. تغطي عملية إنتاجنا معالجة الورق الأساسي وصياغة الطلاء والقطع الدقيق تحت منشأة واحدة ، مما يسمح بمراقبة أكثر صرامة على توحيد الطلاء وسلوك الامتصاص عبر الدفعات. تدير شركتنا أربعة خطوط طلاء وأربعة ورش عمل للقطع وعشرة آلات للقطع ، مدعومة بمعدات طلاء متقدمة مستوردة من ألمانيا. ويصل الإنتاج الشهري إلى حوالي 3000 طن، مع شحن حوالي 120 حاوية تصدير على مستوى العالم.
بالنسبة لمعايرة مخطط الألوان ، فإن هيكل الإنتاج هذا مهم. بما أن الناتج الأحمر يتأثر بشدة بتماسك سمك الطلاء وخصائص امتصاص الورق ، فإن مخططات الألوان تفقد القيمة التنبؤية ، وتصبح إعادة المعايرة متكررة عندما يختلف سلوك الطلاء بين الدفعات. وتقلل المرافق التي تتحكم في عملية الطلاء داخلياً من هذا التغير، مما يسمح للمشغلين بالاعتماد على بيانات الرسوم البيانية الخاصة بهم عبر دورات الإنتاج الأطول.
شركتنا توفر أيضا الخدمات، مثل تخصيص OEM / ODM ، وخدمة 24 ساعة ، وفرق الدعم التقني ، والتي تتوافق مع الاحتياجات التشغيلية للمصانع التي تدير بيئات الإنتاج المستمرة.
كيف تؤثر صياغة الحبر على دقة مخطط الألوان للنغمات الحمراء؟
الكثافة وسلوك السوائل
كيمياء الحبر تشكل بشكل مباشر موثوقية الرسم البياني. تقدم الصيغ ذات الكثافة العالية ألوان حمراء أعمق ولكن يمكن أن تبالغ في ضغط الظل إذا لم يتم تعديل الملفات الشخصية بعناية.
تؤثر استقرار التدفق أيضًا على وضوح الرسم البياني. الحبر الذي يحافظ على سلوك الرفع المتسق يسمح للرسوم البيانية بتعكس سلوك الألوان الفعلي بدلا من تغير الفوهة.
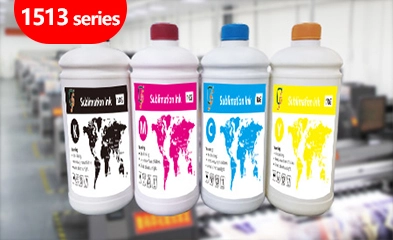
إن 1513 سلسلة حبر التسامي صمم للطباعة المستقرة والمستمرة ويدعم سلوك التدفق السلس خلال عمليات طويلة. عندما يتم طباعة المخططات بتشكيل قطرات متسقة ، تصبح البقع الحمراء أكثر موثوقية لتقييم الملف الشخصي بدلاً من تشوهها بسبب عدم الاتساق الميكانيكي.
متى يجب إعادة معايرة مخططك المرجعي الأحمر؟
المحفزات العملية
يجب إعادة طباعة مخطط الألوان إذا تغير أي من العوامل التالية:
1. دفعة حبر جديدة
2. دفعة ورقة جديدة
3. استبدال رأس الطباعة
تغيير المورد 4.Fabric
5. تغيير كبير في الرطوبة الموسمية
6. ضغط على تعديل خط الأساس لدرجة الحرارة
الرسوم البيانية الحمراء ليست مراجع دائمة، بل أدوات تشغيلية يجب أن تتطور مع متغيرات الإنتاج.
كيف يغير الحبر عالي الكثافة تفسير الرسم البياني؟
تجنب الإفراط في التصحيح
الحبر عالي الكثافة يوسع النطاق الأحمر ، لكنه يزيد أيضًا من المخاطر. قد تتشبع مناطق الظل في وقت مبكر جداً، مما يسبب فقدان التفاصيل. في بعض الأحيان يقوم المشغلون بتصحيح الملفات الشخصية بشكل مفرط لاستعادة تفاصيل الظل ، مما يضعف تشبع النغمة الوسطى.
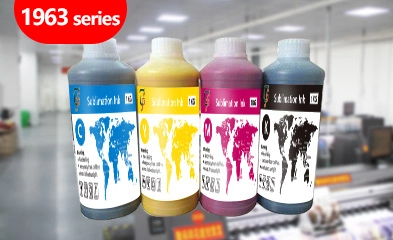
إن 1963 سلسلة حبر التسامي يتم صياغتها لإنتاج الكروم العالي. عند استخدامها للمعايرة القائمة على الرسم البياني، فإنه يتطلب تعديلات منحنى أكثر محافظة. بدلاً من إجبار الظلال على فتحها، من الأفضل الحفاظ على التسلسل الهرمي للنغمة وضبط توازن النغمة الوسطى أولاً، مما يمكن أن يحافظ على العمق دون فقدان الحيوية.
ما هو سير العمل الذي يضمن اتساق الأحمر على المدى الطويل على نطاق واسع؟
إدارة الرسم البياني المنظم
عادة ما تنفذ المصانع التي تحقق إنتاجًا أحمرًا موثوقًا تدفقات عمل مخططات منضبطة:
1. طباعة الرسم البياني الأسبوعي تحت الإعدادات المسيطرة
أرشيف الرسوم البيانية التاريخية للمقارنة
3.Logging معلمات الصحافة جنب عينات الرسم البياني
4. تدريب المشغلين على التعرف على أنماط الانحراف الأحمر
5. ارتباط تحولات الرسم البياني مع التغيرات البيئية
هذا يحول الرسوم البيانية الملونة إلى بيانات تشغيلية بدلا من أدوات عرضية.
لماذا تظل مخططات الألوان المصدر الوحيد الموثوق به للحقيقة للتحكم في المخرجات الحمراء
لا يمكن التحكم في الناتج الأحمر من خلال النظرية وحدها. المعاينة الرقمية، ومحاكاة البرمجيات، والملفات الشخصية المحددة مسبقا هي تجريدات، ولكن الرسم البياني الألوان يلتقط السلوك الكيميائي في ظروف حقيقية.
عند معالجة الرسم البياني كأداة تشخيصية ، ومواءمته مع مواد مستقرة ، ودمجه في التحكم اليومي في العملية ، يمكن أن يصبح اللون الأحمر قابل للتنبؤ بدلًا من أن يكون مشكلة. لا يتم تحقيق الاتساق عن طريق مطاردة الحيوية ، ولكن عن طريق المعايرة الانضباطية المدعومة بسلوك الحبر والورق المستقر.
الأسئلة الشائعة
س1: كم مرة يجب إعادة طباعة مخطط ألوان التسامي للمعايرة الحمراء؟
ج: في أي وقت تتغير دفعة الحبر أو دفعة الورق أو نوع النسيج أو الظروف البيئية بشكل كبير.
Q2: هل يمكن معايرة البرمجيات استبدال مخططات الألوان المادية للتحكم الأحمر؟
ج: لا. يعمل البرنامج على افتراضات، في حين تقوس الرسوم البيانية سلوك النقل الفعلي.
س3: لماذا يظهر الأحمر صحيحًا على ورق النقل ولكن مملًا على النسيج؟
ج: لأن انتشار الصبغة وربط الألياف يحدث فقط أثناء نقل الحرارة ، وليس أثناء الطباعة.


